Contents — find the section you need
Being able to see an autonomous mobile robot's internal state at a glance from outside — sensor connectivity, battery level, current mode — matters not just for diagnosing it during development but for everyday operation. newbot implements this as a simple web dashboard running on the edge unit (a Raspberry Pi 5).
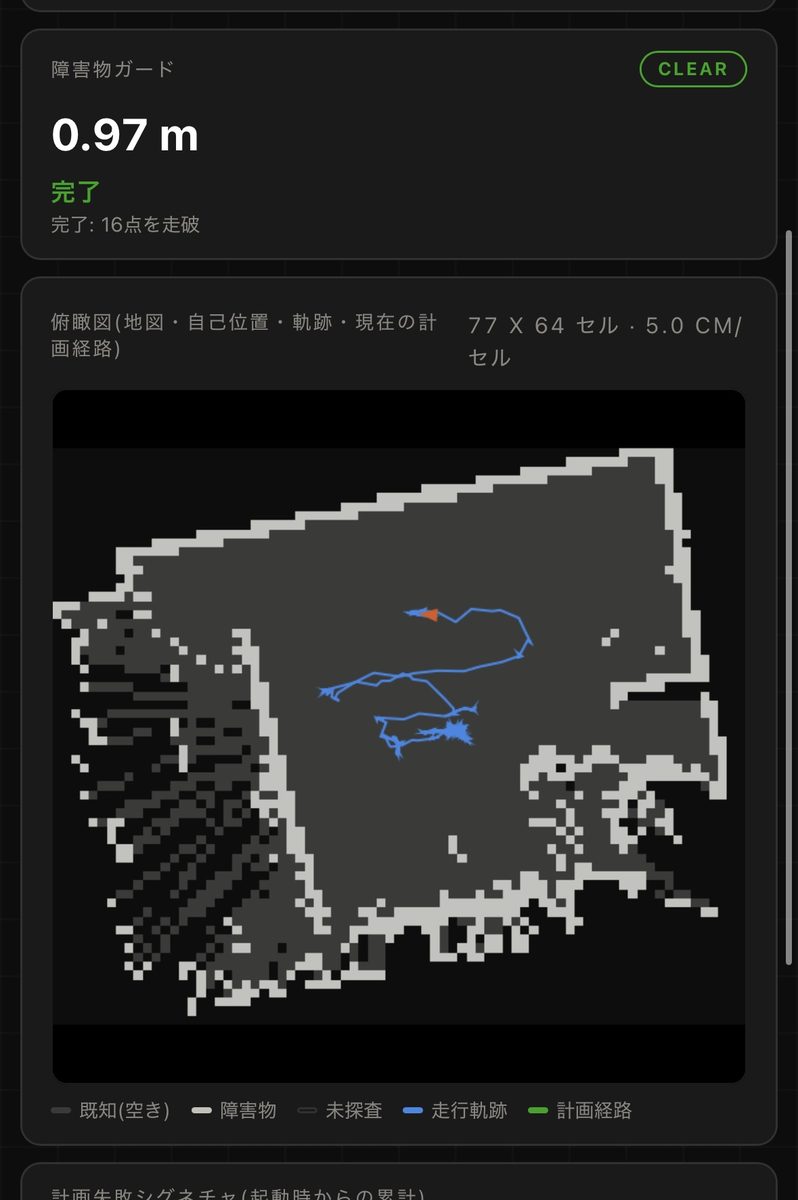
The dashboard screen as actually used.
A Design That Minimizes Dependencies
The dashboard is built entirely on rclpy (ROS2's Python client library) and Python's standard http.server module, with no dependency on any extra ROS package. Once connected in a browser, it shows PC connection status, controller connection status, serial link status with the microcontroller, camera connection status, LiDAR connection status, a live feed from the front camera, motor RPM, battery level, the e-stop/state machine, and mission state, all updated in real time.
As a design principle, the dashboard itself never publishes to the control system (with a single exception: a request to re-pair the controller). It's kept strictly to being a read-only visualization tool.
How Connection Status Is Determined: "Time Since the Last Message"
Each component's connection status is judged by how long it's been since the corresponding topic's last message arrived. The serial link to the microcontroller, for instance, is treated as disconnected if a specific topic's arrival interval exceeds 1 second; the camera gets 2 seconds; the upstream PC (heavy-processing machine) gets 3 seconds — a different timeout per component. This is the same heartbeat logic the safety-supervisor node uses to detect a communication drop, applied here to the visualization layer as well.
Streaming the Camera Feed
The front camera's feed is subscribed to with the QoS setting meant for sensor data (best-effort), and each received frame is JPEG-encoded and streamed as a multipart stream. The browser side can display it with a single <img> tag, with no extra client-side code needed. Since the encoding itself is a real CPU cost on the edge unit, the streaming rate is deliberately capped at 10 fps. A placeholder image is returned whenever no frame has arrived or the feed has dropped, so a missing feed never shows up as a broken-image icon.
The image handling deliberately avoids ROS's image-conversion library (cv_bridge). It wasn't installed on the edge unit, so the raw rgb8 data the camera driver publishes is assembled directly into a width×height×3-channel numpy array and fed straight into OpenCV's encoding function. The same "don't add extra ROS package dependencies" principle carries through to the image-processing entry point as well.
Building this turned up a hard-to-notice trap: a QoS mismatch that leaves messages never arriving at all, with no error raised. Sensor topics are published with best-effort QoS, and if the subscriber side is left at the default QoS (reliability-focused), the connection itself forms fine, but no messages ever arrive. The fix was explicitly checking and matching the QoS settings on both ends.
Auto-Start and Kiosk Display on Pi 5 Boot
Just powering on the edge unit is enough to bring up both the drive-system software and this dashboard automatically, configured to run at system startup. Since the edge unit has a display attached, a setup was also added to auto-launch a browser fullscreen (kiosk mode) on that screen and keep the dashboard displayed continuously. The UI is a fixed single-screen layout with no scrolling needed.
For the communication method, 400 ms polling (a periodic request to /api/status) was chosen over WebSocket. The decision to avoid depending on an extra package like rosbridge came down to a constraint: privileged operations on the edge unit require interactive password entry, which rules out unattended package installation.
Setting up kiosk-mode auto-start surfaced a few gotchas specific to running on real hardware — a systemctl command that would hang because a systemd unit was waiting on a desktop environment's session management to start, a Wayland compatibility-detection issue, and, most seriously, an incident where the pkill pattern meant to stop the kiosk display was too broad and killed the SSH session along with it. Since that incident, any process kill by name has been done with a pattern narrowed down to exactly what it needs to match, without exception.
Tracking Down "The Dashboard Doesn't Show Up on Boot"
Right after kiosk display was added, a problem showed up where the dashboard just wouldn't appear on the screen after powering on, and the only fix each time was to manually restart the service. Two separate causes turned out to be stacked on top of each other.
The first was that the kiosk's URL-wait logic had too short a timeout — 60 seconds. Once that timed out, it would open a URL that wasn't ready yet, and the browser would sit frozen on an error page with no automatic reload. The fix was to wait indefinitely for a response instead of giving up after a fixed timeout.
The second was general slowness from disk I/O contention right after boot. Recording the actual timeline: the kiosk starts and begins waiting on a Wayland socket, the desktop environment itself takes about 2 minutes to come up, the dashboard then takes another 42 seconds to start, and the total time from power-on to the dashboard appearing on screen came to roughly 4 minutes. It turned out that right after boot, a dozen-plus ROS nodes for the drive system (including self-localization, the LiDAR driver, and the camera) were monopolizing storage I/O, crowding out the desktop environment and dashboard startup. The fix was to lower the drive-system service's scheduling priority (nice value) and raise the dashboard's, so the screen comes up first. This doesn't affect responsiveness once the CPU has headroom during actual driving, and since the robot doesn't move during boot, there's no safety concern either.
The lesson from this investigation: something that looks like it's "not coming up" can turn out, once you subtract the timestamps on each log line, to be not broken at all — just slow.
Fighting Off Unwanted UI Overlaying the Kiosk Screen
Beyond functional bugs, building out the kiosk display also meant dealing individually with a handful of UI elements that showed up on screen uninvited.
- An "Unknown application" notification banner across the top of the screen appeared because the browser wasn't launching through a proper application launcher, leaving the OS unable to identify where the notification came from. Disabling the desktop environment's notification setting outright resolved it.
- A strip of application icons (a dock) along the edge of the screen stayed visible because the fullscreen-detection mechanism didn't recognize how the browser was actually running. Explicitly enabling the dock's auto-hide setting resolved it.
- A translation-prompt popup in the top-right corner didn't go away even when passing launch flags meant to disable the browser's translation feature — those flags simply had no effect on the real hardware. The fix that finally worked was embedding a "please don't translate this" directive directly into the page itself (an HTML language attribute plus a no-translate meta tag), sidestepping reliance on the browser's own flags entirely.
The most dangerous detour came while trying to get rid of that translation popup. One approach tried was pre-creating the browser's own preferences file by hand, ahead of time. The browser treated that file as an invalid profile and exited immediately, and combined with the system's auto-restart setting, that produced an infinite restart loop. The lesson: a preferences file like this must always be left for the browser itself to generate — never hand-written from outside.
An Operational Note on Flashing Firmware
Since the systemd service on the edge unit is set to keep restarting the ESP32 communication node automatically, flashing firmware without first stopping that service means the two end up fighting over the serial port, and the flash fails. The standing rule is to stop the service before flashing and restart it once the flash is done.
A Design Regret: A Safety Mechanism with No Way to Recover
Building out the safety mechanisms surfaced a pattern more than once: "the safety mechanism fired correctly, but there's no way to clear it in the field." The monitoring node that detects a communication drop only ever set a flag and kept sending an emergency-stop request — with no way built in to release it — so recovery required nothing short of an administrator restarting the process. Similarly, if the self-localization node lost tracking, the process itself just kept running, continuing to output broken values, with no service available to reset its internal state.
A safety mechanism that needs administrator privileges to recover from is, eventually, one that gets powered off entirely in the field — which ends up hurting safety, not helping it. Working from that realization, the emergency-stop flag was changed to be clearable via an external request (while the underlying fault condition persists, it re-fires on the very next cycle — safety is never loosened). The self-localization node was similarly changed so the monitoring node rebuilds the whole process from scratch when it detects a fault. This principle — "once it fires, can someone in the field clear it without administrator privileges" — is now used as a checklist item whenever another safety mechanism gets reviewed.
Revisiting False-Positive Thresholds from Measurement
Real-hardware testing also taught a lesson about how basing a false-detection threshold purely on the machine's rated performance can become its own source of false positives. The threshold for detecting a mismatch between self-localization and wheel odometry was originally set to "4x the machine's top speed" — a seemingly reasonable value — but that turned out to be easily exceeded just by someone picking the robot up and setting it back down on the floor. The estimated values during an actual anomaly (a runaway) were more than an order of magnitude larger than that measured threshold, so the threshold was raised, worked backward from the numbers seen in real anomaly cases, tuned so day-to-day handling no longer triggers a false positive.
Traps Repeatedly Hit During Diagnosis
The development and diagnosis process also left a record of the same category of mistake being repeated more than once: a publish rate that looks normal while the content underneath is broken; subscribing without checking a topic's type, silently ending up with zero messages and misdiagnosing it as "broken"; filtering processes by name matching the filtering process itself; a ros2 launch being stopped but leaving a child process behind, leading to an accidental double-start; a one-off publish disappearing before DDS discovery has even finished. All of these share the same shape — "looks broken, but is really just not being observed correctly for some other reason." In particular, the lesson that visualizing something directly beats stacking up indirect measurements for finding a root cause faster was itself part of the motivation for building this dashboard in the first place.
Does a connected indicator establish fresh data?
Connection state and recent message delivery differ. Check the last received timestamp and information age.
Comments
Please log in to post a comment
No comments yet.