Contents — find the section you need
A server just running isn't enough — it needs to detect its own problems and get word to you. Here's the monitoring dashboard (Netdata), the notification pipeline (ntfy), automatic updates (Watchtower), and the custom monitoring scripts tying it all together.
Netdata: Real-Time Monitoring Dashboard
Netdata visualizes CPU, memory, disk, network, and per-container resource usage in real time with essentially no configuration. It defaults to being exposed on every interface with no authentication, so it's bound to loopback instead, reachable only through the dedicated tunnel when actually needed.
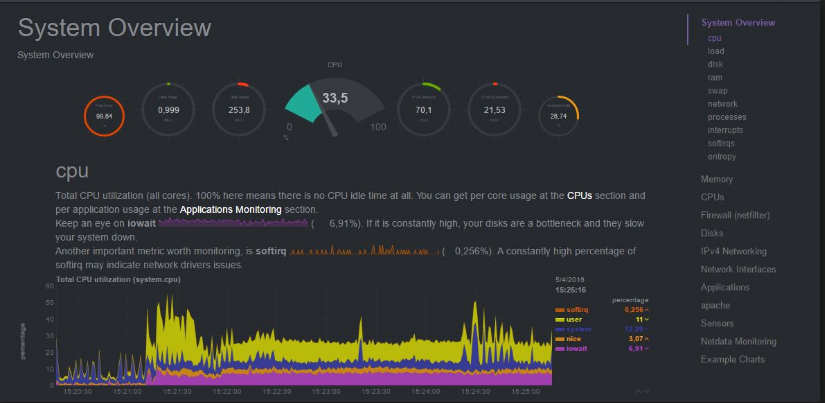
An example Netdata dashboard (from the official distribution). CPU, memory, network, and other metrics are graphed automatically.
ntfy: Notification Delivery
ntfy is a simple push-notification service — one HTTP request is enough to send a notification to a phone. The flow is strictly one-directional: the monitoring scripts publish only when they detect a problem, and the phone just subscribes.
The Elevated Privileges Given to Netdata, and Why
Netdata visualizes not just per-container resource usage but the host OS's processes, network, and kernel statistics as a whole, so it's granted more privilege than a typical container (process tracing, system administration) and has some of the container security restrictions (AppArmor) loosened. That's an unavoidable trade-off for a monitoring tool of this kind — the counterweight is binding it to loopback and making it reachable only through the dedicated tunnel, so this privileged container can never be reached directly from outside.
The authentication model is different from a cloud-based monitoring service, too: instead of relying on an external account system, the first access triggers a purely local session authentication — a session key auto-generated inside the container on first run gets pulled straight out of the container's filesystem and typed into the browser. No data ever leaves for an external cloud service, but in exchange, retrieving the key at all requires access to the container itself — an authentication model that only makes sense on the assumption you're self-hosting.
One small bug turned up in operation: a directory some plugins expect to find at startup, holding auxiliary scripts, wasn't present in the image, and it logged an error every single minute as a result. Just creating the directory fixed it. No real harm done, but left alone, noise like that is exactly what buries the warning in the log that actually matters — so the policy is to squash these the moment they're spotted.
Watchtower: Automatic Container Image Updates
 Watchtower
Image: Netdata dashboard, Watchtower logo, Wikimedia Commons


Watchtower periodically checks the images behind running Docker containers and recreates them automatically when a new version shows up. Services where an unexpected automatic update would be undesirable for security reasons — password management, for instance — are excluded. Results are reported via ntfy, using Watchtower's own built-in notification-format converter (shoutrrr) pointed directly at ntfy's API endpoint, with no extra service in between. Every excluded container carries a comment in its own service definition explaining why it's excluded — so that six months from now, there's no need to re-investigate "why doesn't this one update automatically." It's a habit built on the realization that the more mundane and taken-for-granted something is — like a drink or a power outlet — the more surely the reasoning behind a decision gets forgotten if it isn't written down.
Custom Monitoring Scripts
For the services deliberately excluded from Watchtower's automatic updates (password management, file sharing, the home-automation platform), a separate script just watches for whether an update exists. It pulls each service's latest stable tag from the GitHub Releases API, compares it against the running version, and sends a notification if there's a difference. It uses the endpoint that automatically excludes pre-releases and drafts on the API side, so there's no need to write that filtering logic by hand. It's intentionally not automatic — these are services where the update path includes steps that carry real risk if run unattended, like verifying config-migration compatibility or getting the upgrade steps in the right order. It runs weekly, Sunday morning, and if the GitHub API itself is unreachable or rate-limited, that just gets logged with no notification sent — keeping a transient fetch failure distinct from an actual version bump.
Health Checks: Periodic Self-Inspection
A health-check script runs every 15 minutes and confirms:
- Free disk space (across multiple storage volumes, each with its own threshold)
- That containers meant to run continuously are actually running
- That the related systemd services aren't in a failed state
- That the most recent backup was created within an expected window (detecting whether the automated run has silently stopped)
- That backups aren't being written to the local fallback location instead of the intended dedicated disk (a sign the dedicated disk wasn't connected)
- That the firewall rule blocking LAN access is still in effect (in case an OS update silently removed or disabled it)
A Bug in the Monitoring Script Itself
That last check — the firewall rule — works by calling a host-OS (Windows) command from inside WSL2. On the very day it was introduced, though, this check spent several hours firing a warning every 15 minutes claiming the rule was "missing or disabled." The rule was, in fact, still enabled the whole time — a false positive.
Tracing the cause led back to how the host-OS command was invoked: by name, relying on PATH resolution, rather than by full path. Run the script by hand from an interactive shell, and WSL's integration feature resolves that name to the right binary without issue. Run it as a systemd service, though, and that interactive-shell PATH resolution simply doesn't exist — the command can't be found, and the check always got back an empty string, which it then read as "rule not found." Fixing it was as simple as specifying the command by full path — but pinning down the cause required reproducing systemd's actual runtime environment and running the script by hand against it. Lesson learned: for any script under systemd that calls a host-OS executable through WSL2, testing it in an interactive shell isn't enough on its own — always specify the full path.
Backups: Separating Critical Data from Bulk Data
Backups are split into two categories with two different destinations: small but irreplaceable data (passwords, config files, database dumps), and large but tolerant-of-loss data (photos, videos, where keeping several local generations is good enough). The former is small enough to fit within a cloud storage free tier, so it's also kept offsite (uploaded to the cloud); the latter is far too large for any free tier, so it stays local only. The media library itself (movies, TV shows) that the streaming service uses is deliberately excluded even from the bulk-data backup — it's content that can be re-acquired from its source, and leaving it out reflects a policy of prioritizing backups by whether something is actually irreplaceable.
Photos and videos are already compressed, so gzip barely helps, and single-core compression made processing that much data painfully slow (roughly 50 minutes, measured). Switching to a tool that compresses across all cores fixed that. Separately, depending on exactly when a backup job runs, the target container can sometimes be freshly started and still mid-initialization, making its files temporarily unreadable. That actually happened once: a job ran right after a late-night PC startup, and files owned inside a container were temporarily unreadable, failing the run. A manual re-run 12 minutes later succeeded without issue, which pointed to a transient init-time race rather than anything structural, so the script now waits a fixed interval and retries exactly once for that case.
Beyond the database dump, the critical-data archive also individually specifies each service's definition file, its key config files, and the actual data behind passwords, contacts, and calendars. When the dedicated disk isn't connected, the design falls back to writing the bulk backup to local disk to keep it running — but if that state persists unnoticed, the dedicated disk's own generation retention can silently stop being refreshed. To guard against that, it's paired with the health check's detection of stray fallback artifacts (see the section above). Before this split design existed, both backups were in fact being written to the same disk at one point, and that briefly squeezed free disk space to uncomfortable levels.
Confirming a Backup Actually Works
Taking a backup isn't the finish line. The database dump that gets produced is actually restored into a separate test database container, apart from production, and the record count after restoration is checked against production's real data. A backup job finishing with a clean exit code and that backup actually being usable to restore a service are two different claims — only the second one, once verified, earns the label "a backup that works."
Does silence from monitoring prove healthy operation?
Monitoring or delivery may have failed. Verify monitor liveness and notification delivery independently.
References
- Netdata Official Site / GitHub
- ntfy Official Documentation / GitHub
- Watchtower GitHub (archived and no longer developed as of December 2025; the documentation itself is still accessible)
Comments
Please log in to post a comment
No comments yet.