Contents — find the section you need
Change parameters and verify
Open the panel, then press Run to load Python. You can stop execution and reset parameters. Results are computed on this device. No Python installation is required.
Local execution steps below are optional for reproducing the source results; they are not required for the browser experiment.
Compare the correspondence lines
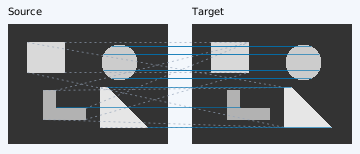
Run the baseline and save A. Try raw matches, rotation, scale or repeated patterns, then compare B. Blue circles and solid lines mean accepted and true; purple crosses and solid lines mean accepted but false. Grey dots show descriptor rejections and orange dashes geometric rejections. Mobile stacks the images. Reset restores defaults; sharing reproduces current controls, not saved A.
From points to descriptors
The shared Shi–Tomasi detector selects at most 80 points per image. Each descriptor contains a valid 9×9 grey patch. Choose raw values or mean subtraction followed by L2 normalization. Distance is Euclidean L2. Ratio filtering needs two neighbours and strictly requires d1 < limit × d2; zero second distance fails. Mutual filtering requires each point to be the other's nearest neighbour. Normalization can handle unclipped brightness gain, but these patches have no rotation or scale invariance. This is not ORB or SIFT.
Geometry and ground truth
Optional geometric verification fits a similarity: translation, rotation and uniform scale, without shear or perspective. It exhaustively tests two-pair hypotheses, requires at least three supporters, refits once and checks target-pixel residuals. With fewer than three candidates or no usable model, it accepts nothing. With geometry off, descriptor-filtered matches are accepted and model metrics are undefined.
Model inlier ratio divides inliers by descriptor-filtered candidates. Separately, the true fraction of accepted matches uses the known transform and a fixed 3-pixel tolerance. Truth RMS measures those accepted endpoint errors; model RMS measures fitted residuals. Grid RMS compares estimated and true transforms on a fixed visible grid. Empty denominators show —. A coherent wrong model can have small residuals: the 30° preset deliberately demonstrates this. Repeated patterns do not establish object identity.
Recorded examples
These are computed results from the shipped presets. Images, masks and transforms reuse the extraction Lab: bilinear sampling, box blur, gain, fixed uniform noise and clipping. Encoded grey values are not physical luminance; downscaling has no antialiasing prefilter. The source package documents exact thresholds, ties, support masks and grid coordinates. JSON exports retain pixels and every proposed pair.
| Preset | Nearest | Filtered | Accepted | Model inlier ratio | True / accepted |
|---|---|---|---|---|---|
| Baseline | 22 | 11 | 11 | 100.0% | 100.0% |
| 30° rotation | 22 | 6 | 3 | 50.0% | 0.0% |
| 30° · threshold 6 px | 22 | 6 | 5 | 83.3% | 0.0% |
| Repeated · unfiltered | 80 | 80 | 80 | — | 7.5% |
| Repeated · filtered | 80 | 1 | 0 | — | — |
| No texture | 0 | 0 | 0 | — | — |
Continue learning
- Feature extraction Lab
- Feature tracking theory
- Visual SLAM overview
- Source, model definitions and reference tests
- Recorded metric JSON
- OpenCV matcher reference
Track these features between two frames in the optical flow Lab.
Image brightness and luminance Lab — exposure, gamma and clipping
Comments
Please log in to post a comment
No comments yet.