Contents — find the section you need
Change parameters and verify
Open the panel, then press Run to load Python. You can stop execution and reset parameters. Results are computed on this device. No Python installation is required.
Local execution steps below are optional for reproducing the source results; they are not required for the browser experiment.
Try a comparison
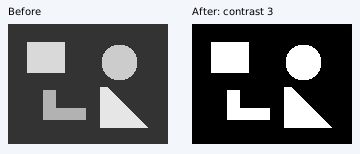
Run Identity and save it as A. Compare Linear exposure +1 EV with Encoded gain 2×. Tap an image or enter x/y to inspect C and Y at the same coordinate before and after processing. Switch to gradients to inspect changes at boundaries. Shared URLs save input conditions, not result A or the inspection coordinate.
Controls are available in Japanese and English. No local Python installation is required.
Pixel values and relative luminance
C is an encoded grey value from 0 to 1. This Lab assumes neutral sRGB, R=G=B, and decodes it to linear relative luminance Y. C=0.5 gives Y≈0.214. These values are not calibrated camera or display measurements and cannot be reported as physical luminance in cd/m².
Processing order
EV multiplies linear Y by 2^EV. Clamp to 0–1 and encode to sRGB; then apply encoded gain and offset, contrast about 0.5, another clamp, and gamma. γ>1 lifts intermediate values. There is no clamp immediately after gain and offset. Darkening later cannot recover distinctions lost in the first clip.
Y = decode_sRGB(C) × 2^EV
C₁ = encode_sRGB(clamp(Y, 0, 1))
z = gain × C₁ + offset
z = 0.5 + contrast × (z − 0.5)
C_out = clamp(z, 0, 1)^(1/gamma)
Read the measurements
Histograms count actual pixels in 32 equal bins, including the left edge and including 1 only in the last bin. C and Y are counted separately. Mean Y averages decoded pixels. Gradients use right and down forward differences over 159×119 positions. Images use fixed C=0–1 and gradients fixed 0–√2 scales. Clipping counts strict values below 0 or above 1 before a clamp, distinct from final endpoint occupancy. The unique count removes overlaps between stages.
| Condition | Mean C | Mean Y | Mean gradient [C/px] | Clipped pixels |
|---|---|---|---|---|
| Identity | 0.33267188 | 0.16471655 | 0.01921348 | 0 |
| Exposure +1 EV | 0.43543366 | 0.26062524 | 0.02188713 | 3331 |
| Encoded gain 2× | 0.52753125 | 0.31717897 | 0.01868123 | 4081 |
| Contrast 3× | 0.21255208 | 0.21255208 | 0.03113539 | 19200 |
| Low contrast | 0.46653438 | 0.18743543 | 0.00384270 | 0 |
| Exposure −2 EV | 0.16257348 | 0.04117914 | 0.01078320 | 0 |
| Gamma 2 | 0.54494622 | 0.30339745 | 0.01418886 | 0 |
| Low texture | 0.41000000 | 0.14130621 | 0.00075472 | 0 |
Connect to computer vision
Compare the low-contrast and low-texture presets. The same synthetic scenes appear in extraction, matching and optical-flow Labs. Gradient changes alter detector inputs; illumination changes can violate brightness constancy in flow. A histogram alone does not measure detection, correspondence or tracking accuracy.
Comments
Please log in to post a comment
No comments yet.