Contents — find the section you need
Background and reading guide
Background Voltage, current, power, energy and unit conversion.
Fundamentals · Explanations of principles, structure and trade-offs.
Watch the white plume rising from a thermal power plant's stack and think "the fuel's heat becomes electricity directly," and you lose sight of why efficiency and environmental burden matter. In reality, the plant converts a fuel's chemical energy into the heat of combustion gas, spins a turbine with steam or high-temperature gas, and hands the power to the grid through a generator and transformer. The boiler, turbine, condenser, flue-gas treatment, and cooling equipment are all bound together by a tradeoff between efficiency and output flexibility.
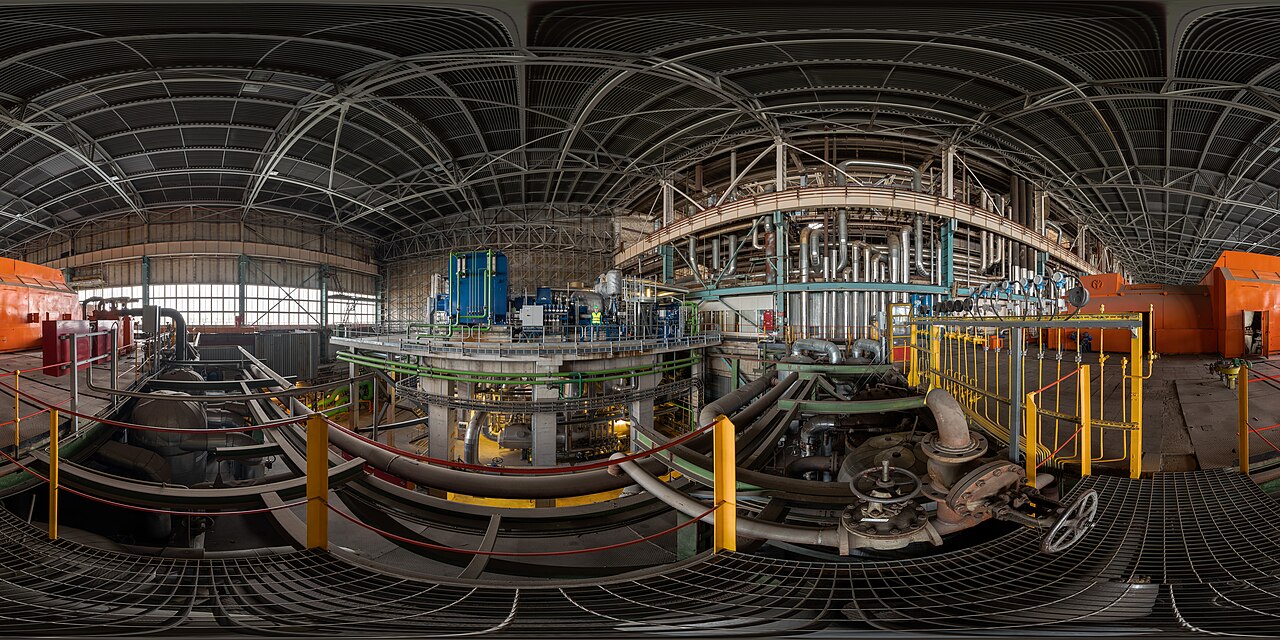 Turbine and generator example
Image: Waste block turbine and generator in Iru Thermal Power Plant (Lauri Veerde, CC BY-SA 4.0), Wikimedia Commons. An interior example, not a photograph of the specific plant used in the comparisons.

The 30-second version
- A steam turbine runs on the Rankine cycle; a gas turbine runs on the Brayton cycle. A combined cycle (CCGT), which also makes steam from exhaust heat, reaches high efficiency.
- Generation efficiency depends not just on combustion temperature but on steam pressure and temperature, condenser vacuum, cooling-water temperature, partial load, and how often the unit starts and stops.
- Coal is a stable fuel, but the burden of handling CO₂ and air pollutants is heavy. Natural-gas CCGT emits less and starts faster, but is exposed to methane leakage and fuel-price swings.
- Decarbonization pairs thermal with renewables and batteries, and compares biomass, hydrogen/ammonia co-firing, and CCS/CCUS on a lifecycle basis.
- For thermal power backing up variable generation, value is set less by output than by minimum load, ramp rate, startup time, synchronous inertia, and emissions intensity.
1. The path from heat to electricity
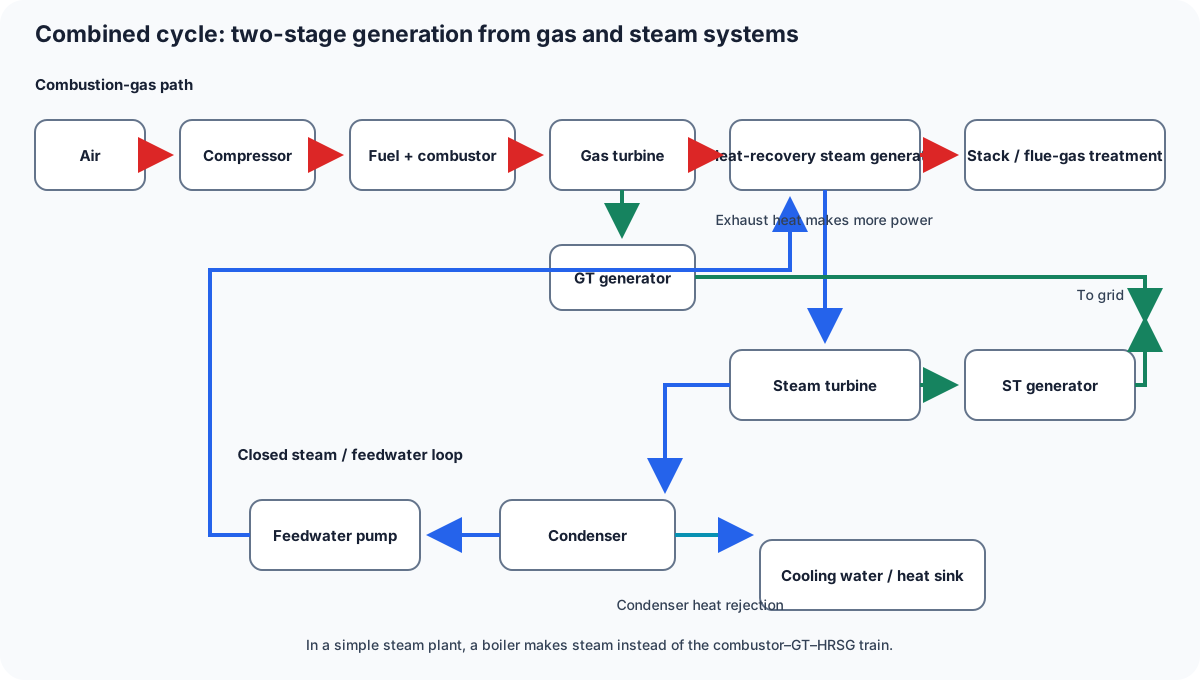
Figure 1 — A combined cycle first drives a gas-turbine generator, then transfers exhaust heat through the HRSG to steam for a second turbine-generator. The steam is condensed, pumped, and returned to the HRSG; a separate cooling-water system removes condenser heat.
Let Q_{in} be the chemical energy of the fuel input and P_e the electrical output; generation efficiency can then be estimated as
The send-out efficiency is electrical output divided by fuel input after auxiliary consumption.
where \dot m_f is the fuel mass flow rate and LHV is the lower heating value. It matters to compare at send-out efficiency — after subtracting the power consumed by auxiliaries (feedwater pumps, forced-draft fans, flue-gas treatment, cooling-water pumps).
2. The Rankine cycle and steam turbines
In boilers that burn coal, heavy oil, biomass, and the like, water is converted into high-pressure steam. The steam expands in stages through the high-, intermediate-, and low-pressure turbines, returns to water in the condenser, and is fed back to the boiler by the feedwater pump. The ideal Rankine cycle's thermal efficiency is
The Rankine efficiency is the net turbine work divided by boiler heat input.
and it's improved through reheat, regenerative feedwater heating, and going supercritical.
The higher the steam temperature, the higher the efficiency — but creep, oxidation, and corrosion in the boiler tubes, turbine blades, and welds all get more severe. Ultra-supercritical (USC) units use high-Cr steel and Ni-based alloys, and material lifespan and maintenance intervals end up setting the generation cost. At the turbine's final stage, water droplets in wet steam erode the blades, so moisture separators and reheaters are placed to address it.
The condenser turns steam back into water at low pressure, lowering the turbine outlet pressure to increase the work extracted. When seawater temperature is high in summer or cooling-tower performance drops, condenser pressure rises and both output and efficiency fall. Not just the heat source but the cooling water and the environmental conditions of the river or sea it draws from are part of the thermal cycle.
3. Gas turbines and combined cycles
A gas turbine compresses air in a compressor, burns fuel in the combustor, and expands the resulting high-temperature gas through a turbine. The ideal Brayton cycle's efficiency is roughly set by pressure ratio r_p and specific-heat ratio \gamma as
The ideal Brayton efficiency rises with pressure ratio, subject to compressor and turbine limits.
Raising the pressure ratio raises ideal efficiency, but compressor work, blade temperature, surge margin, and cooling air all become constraints.
A simple cycle's exhaust gas is still hot. A combined cycle (CCGT) that adds a heat-recovery steam generator (HRSG) to make steam and a steam turbine to use it extracts the fuel's heat in two stages. Natural-gas CCGT combines high send-out efficiency with a comparatively short startup time, and is used as flexible generation that tracks solar and wind variability.
On the other hand, repeated starts and stops raise thermal stress and consume lifespan. CCGT operation needs to optimize not just efficient rated-load running but also emissions at low load, minimum output, ramp rate, fuel supply, and maintenance planning.
4. Flue-gas treatment and environmental burden
Carbon in the fuel becomes mainly CO₂; nitrogen plus high-temperature combustion produces NOx; sulfur becomes SOx; and ash content becomes particulate matter. DeNOx (SCR), electrostatic precipitators or bag filters, and desulfurization equipment are combined to meet emissions regulations. Desulfurization reagent, ammonia, fans, and absorbent-liquid circulation all add to auxiliary power consumption and waste, so emissions should be calculated for the whole facility, not just the stack concentration.
A fuel's CO₂ emissions can be estimated from fuel consumption and carbon content.
Fuel carbon content and the molecular mass ratio from carbon to CO2 determine direct emissions.
Here w_C is the carbon mass fraction in the fuel. When comparing power sources, look at g-CO₂/kWh on a send-out basis rather than at the generator terminals, the lifecycle including equipment manufacturing, fuel transport, and disposal, and separate out capacity factor and startup emissions.
5. Hydrogen/ammonia co-firing and CCS
Hydrogen emits no CO₂ when burned, but its production method determines the emissions attributable to it as a power source. Blue hydrogen from natural-gas reforming plus CCS, and green hydrogen from electrolysis using renewable electricity, both need to be assessed including energy efficiency, transport, leakage, and storage. Hydrogen has high flame speed and ignitability, so flashback in the combustor, NOx, and material embrittlement all need to be addressed.
Ammonia is easy to transport as a liquid, but its slow combustion speed makes unburned ammonia (slip) and NOx treatment a challenge. Raising the co-firing ratio increases both the scope of retrofit work and fuel cost, so it needs to be weighed against extending the life of existing plants, building new dedicated-firing units, and comparing against renewables plus batteries.
CCS (Carbon Capture and Storage) separates CO₂ from flue gas, compresses it, transports it, and stores it underground. Amine absorption uses steam and electricity for separation, cutting generation efficiency by several points. Practicality needs to be evaluated including storage-site exploration, leak monitoring, phase management in the pipeline, and long-term liability. Where CCUS uses captured CO₂ as feedstock or fuel, it's also worth confirming how long before it eventually returns to the atmosphere.
6. Value in grid operations
A thermal power plant can deliver continuous output as long as fuel is secured, and supplies the grid with the inertia and short-circuit current of a synchronous generator. Some gas-turbine units can start in minutes to tens of minutes, making them well suited to supply-demand balancing. Coal-fired and large steam-turbine units have higher minimum loads and longer startup times, and frequent load-following consumes their lifespan.
Let the ramp rate be R=dP/dt, the minimum load P_{min}, and the startup time t_{start}; the range over which the unit can cover renewable forecast error is then better evaluated than by rated output alone, as
Available dispatch range is constrained by ramp rate, elapsed time, and minimum stable load.
Pairing thermal with batteries, hydro, demand response, and interconnectors reduces how much a thermal unit needs to sit idling at low load.
7. Reading today's equipment and research
In Japan, TEPCO/JERA, Kansai Electric Power, Tohoku Electric Power, and others are pushing forward on higher-efficiency LNG thermal, environmental controls for coal-fired plants, and operational coordination with renewables. Overseas, GE Vernova, Siemens Energy, and Mitsubishi Heavy Industries are rolling out large gas turbines, steam turbines, CCGT, and ammonia/hydrogen-capable combustors. Beyond product names, it's worth comparing rated efficiency, minimum load, startup time, fuel specifications, maintenance interval, and emissions guarantees.
Research themes span ultra-high-temperature materials, low-NOx combustors, AI-driven boiler combustion optimization, heat recovery, hybridization with solid oxide fuel cells, CO₂ separation membranes, and lifespan models for flexible operation. It's important to confirm whether a new technology's efficiency gains still hold up once auxiliary power, catalyst replacement, fuel pretreatment, and grid-connection costs are included.
Conclusion
Thermal power is a technology that designs fuel, combustor, thermal cycle, turbine, generator, flue-gas treatment, cooling, and grid operations as one integrated whole. On efficiency alone, going to higher temperature and combined-cycle configurations wins out — but material lifespan, start-stop cycling, fuel supply, CO₂/NOx, cooling water, and local environmental conditions all constrain it at the same time.
When evaluating equipment or research, it helps to check: (1) which cycle, and at what temperature and pressure; (2) send-out efficiency and part-load performance; (3) how many minutes it takes to change output, and how many years of lifespan that consumes; and (4) what the emissions look like once fuel production, transport, flue-gas treatment, and CCS are all included.
Can thermal plants be compared by efficiency numbers alone?
Align heating-value basis, gross versus net output, and load conditions. Efficiency also changes at part load.
References
- Agency for Natural Resources and Energy — Thermal Power and Power Generation Mix (Japanese)
- IEA — Gas and Coal
- IEA — Carbon Capture, Utilisation and Storage
- ASME — Power and Energy
- GE Vernova — Gas Power
- Mitsubishi Heavy Industries — Energy
8. Heat balance and net output
9. Enthalpy accounting in the Rankine cycle
10. CHP and the upper bound of efficiency
11. Gas-turbine work and combined cycles
12. Materials and thermal stress
13. Emissions intensity and CCS
14. A worked 30 MW example
15. Japanese primary sources
- Agency for Natural Resources and Energy, 2025 energy white paper
- Agency for Natural Resources and Energy, power generation mix
- JERA thermal power transition
- NEDO hydrogen and ammonia
- NEDO thermal power report
- MHI thermal power review
- NETL combined-cycle methodology
16. Review checklist
Check the heating-value basis, gross versus net output, part-load behavior, ramp rate, startup life consumption, fuel supply, cooling-water constraints, and lifecycle emissions before comparing two thermal units.
17. Auxiliary power and cooling losses
18. Heat recovery and steam conditions
19. Combustion control and NOx
20. Flexible operation and maintenance
21. Fuel lifecycle boundaries
22. Safety and monitoring
23. Scope of the comparison
For a consistent notation cross-check, the Japanese edition also uses \eta=W_{net}/Q_{in}, P_{gross}, \dot Q_{condenser}, \dot Q_{stack}, P_{aux}, \dot m_f, H, h, w_p\simeq v(P_2-P_1), T_H, T_L, \eta_g, \eta_s, \eta_g=0.40, \eta_s=0.35, \eta_{CC}=0.61, \Delta T, E, \alpha, \nu, EF_{fuel}, NH_3, N_2O, and r.
Additional sources used by the Japanese edition are low-carbon fuels and CCUS for power. The SVG namespace follows W3C SVG and is repeated here to match the diagram markup: W3C SVG.
Current step · 3 / 15 · Power Engineering Primer
Comments
Please log in to post a comment
No comments yet.