Contents — find the section you need
For a home server, consider long idle periods and energy per completed workload as well as peak watts. This article provides a plug-in-meter logging method. No real server was measured; the attached 40 W data is synthetic arithmetic validation.
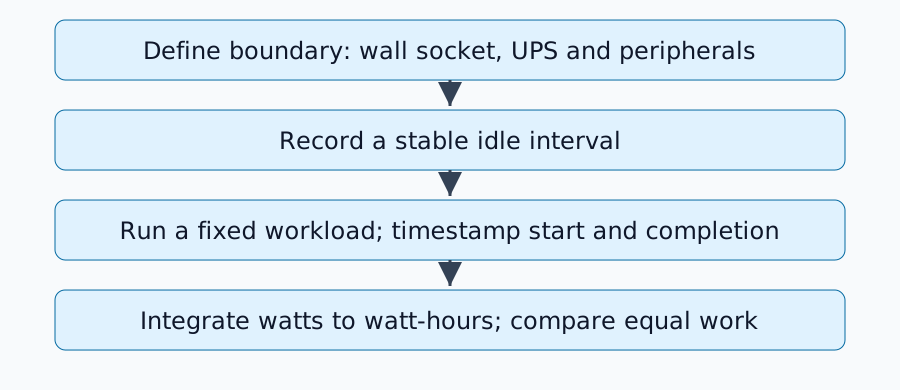
Fix the measurement boundary
Specify whether the meter covers only the server, UPS losses, external storage or networking equipment. Use a suitably rated meter; no internal wiring modification is required.
Read active power W and energy Wh. Voltage times current gives apparent power VA; power factor matters for AC loads. Do not treat V×A as consumed watts without that distinction. See Yokogawa’s power-measurement fundamentals for active/apparent power and power factor. Record meter resolution, accuracy, logging interval and low-load range from its manual.
Define an idle state
Avoid startup updates and indexing. Record services, CPU settings, GPU model residency, disk rotation state, display, fans and room temperature. Choose a settled interval, not just a low CPU percentage. A ten-minute window can miss a task that runs every thirty minutes; begin with a longer log to identify cycles.
Spun-down and rotating disks are separate conditions. Energy savings, first-access latency and start/stop count are distinct evaluation axes.
Hold inference and storage work fixed
For AI, fix model, quantization, prompt, output limit, concurrency and cache state. Use local-LLM measurement to align request start/completion and generated counts with the power log. Separate loading-inclusive from resident-model tests.
For storage, fix file count, bytes, reads/writes and cache state using dedicated test data. Define completion as application return or synchronization completion. Cache-hit reads do not measure the disk alone.
Integrate watts over time
With timestamps t in seconds and power P in watts, a trapezoidal approximation gives:
Divide Wh by duration in hours for mean W. Constant 40 W for 600 s gives 6.667 Wh. Assuming 40 W continuously for 24 hours over 30 days gives 28.8 kWh. These are arithmetic examples, not this site's measured usage or a bill forecast.
Try CSV integration
Save power_log.py and the synthetic CSV together. Execution was checked with Python 3.12.3 using only its standard library:
python3 power_log.py server-power-synthetic.csv
Expected output: duration_s=600, mean_W=40, energy_Wh=6.666666… and samples=601. The validation result is available. Use time_s,power_W columns and one continuous interval per file. The tool rejects duplicate times, nonfinite values, negative power and gaps over 2 s. This default assumes 1 Hz logging; explicitly change --max-gap for another interval.
peak_sampled_W is the largest sample, not a guarantee about between-sample peaks. A meter reporting interval averages may require integration matched to that output convention.
Interpret comparisons
Report total Wh separately from incremental Wh after subtracting idle mean W times workload duration. Subtraction assumes the idle state would have persisted and does not precisely isolate CPU, GPU or disk energy. Fans and power-supply efficiency can change even when one workload setting changes.
Higher watts can still yield lower Wh if equal work finishes sooner. Long idle periods can also outweigh small savings on short jobs. Include boundary, environment, logging interval, repetitions, duration, mean W, Wh and completed work in each comparison.
Comments
Please log in to post a comment
No comments yet.